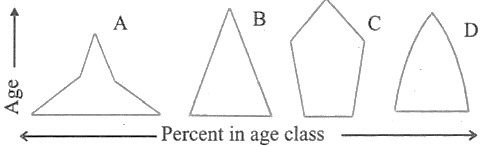
- 16CSAT - 2018
Consider the following graph:
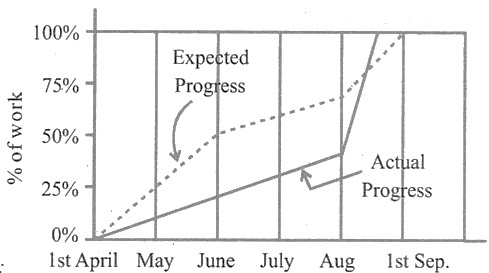
Which one of the following statements is not correct with reference to the graph given above?
Show answerHide answer
Answer: D. During the period from 1st April to 1st September, at no time was the actual progress more than the expected progress.
View solution - 22CSAT - 2015
The graph below depicts the earnings of A and B over the period 2000 to 2010:
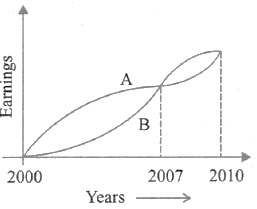
From the graph, which one of the following can be concluded?
Show answerHide answer
Answer: A. On the average A earned more than B during this period.
View solution - 40CSAT - 2011
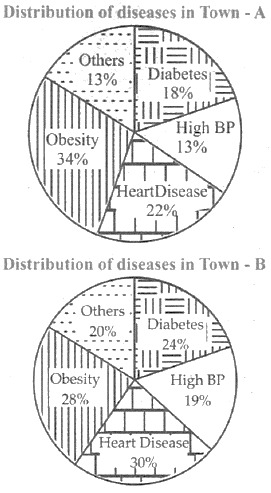
The following pie charts show the breakup of disease categories recorded in the patients from two towns, Town A and Town B. Pie charts plot the disease categories as percentage of the total number of patients. Based on these, answer the question that follows.
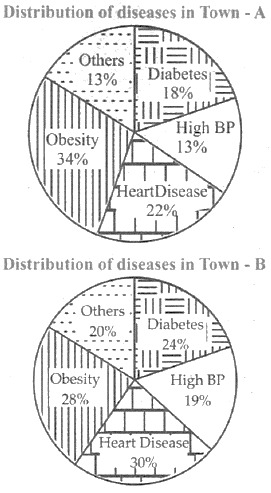
What can we say about persons with more than one disease from these graphs?
Show answerHide answer
Answer: B. There are likely to be persons with more than one disease in Town B.
View solution - 45CSAT - 2011
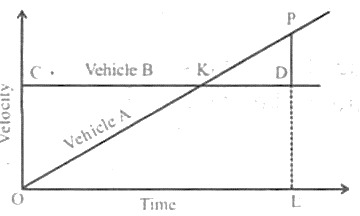
Consider the following Velocity — Time graph. It shows two trains starting simultaneously on parallel tracks.
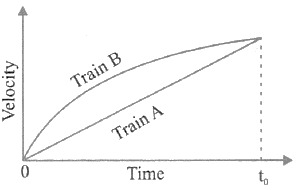
With reference to the above graph, which one of the following statements is not correct?
Show answerHide answer
Answer: D. Both trains travel the same distance in time t 0 units.
View solution
 LD:
LD: