UPSC CSE Prelims 2018
The following graph indicates the composition of our tax revenue for a period of two decades:
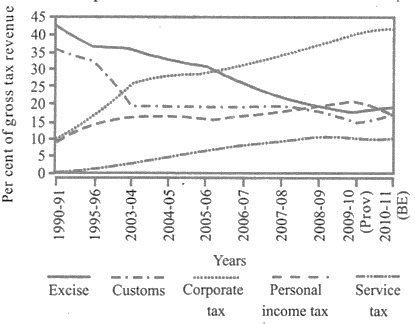
With reference to the above graph, which of the following is/are the most logical and rational inference/ inferences that can be made?
- During the given period, the revenue from Direct Taxes as percentage of gross tax revenue has increased while that of Indirect Taxes decreased.
- The trend in the revenue from Excise Duty demonstrates that the growth of manufacturing sector has been negative during the given period.
Select the correct answer using the code given below.
EXPLANATION
Correct Option
Statement 1 is correct. Direct Taxes typically include Corporate Tax and Personal Income Tax. Indirect Taxes generally comprise Excise Duty, Customs Duty, and Service Tax. Analysis of the graph indicates a discernible trend where the proportion of revenue derived from Direct Taxes, as a percentage of the gross tax revenue, increased over the two-decade period. Concurrently, the share of revenue from Indirect Taxes exhibited a decrease during the same timeframe.
Incorrect Options
Statement 2 is incorrect. While the graph may show a general decline in Excise Duty revenue, with a minor increase observed after 2010, this trend does not definitively establish negative growth in the manufacturing sector. A decrease in Excise Duty revenue could result from various factors, including reductions in tax rates implemented to stimulate industrial growth, changes in the tax base, or structural reforms in the taxation system. Therefore, inferring negative growth in the manufacturing sector solely from the trend of Excise Duty revenue is not a logical or rational conclusion.