UPSC CSE Prelims 2018
The following graph shows imports of three different types of steel over a period of six months of a year. Study the graph and answer the questions.
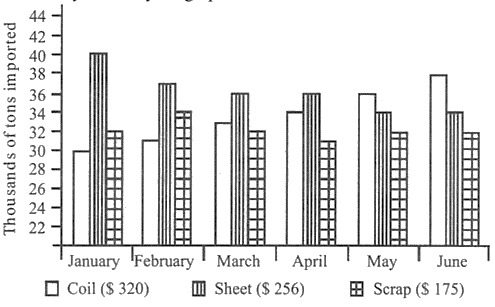
The figures in the brackets indicate the average cost per ton over six months period.
By how much (measured in thousands of tons) did the import of sheet steel exceed the import of coil steel in the first three months of the year?
EXPLANATION
Correct Option (C)
To determine the extent to which sheet steel imports exceeded coil steel imports during the first three months, the cumulative imports for each steel type must be calculated from the provided data.
- Total import of sheet steel for the first three months: 40 + 37 + 36 = 113 thousand tons.
- Total import of coil steel for the first three months: 30 + 31 + 33 = 94 thousand tons.
- The difference is calculated as: 113 thousand tons (sheet steel) - 94 thousand tons (coil steel) = 19 thousand tons.
Therefore, the import of sheet steel exceeded the import of coil steel by 19 thousand tons in the first three months.
Incorrect Options:
Options (A) 11, (B) 15, and (D) 23 are incorrect because they do not correspond to the accurate calculation of the difference between the total imports of sheet steel and coil steel for the specified three-month period. The precise calculation yields a difference of 19 thousand tons.