UPSC CSE Prelims 2013
Study the two figures given below and answer the question that follow:
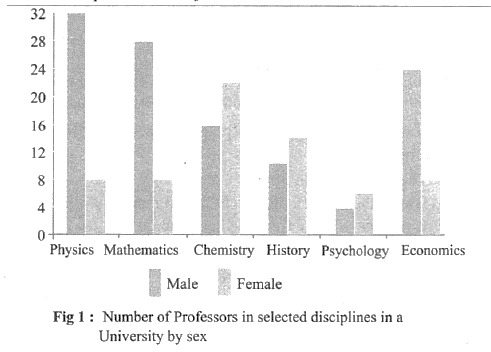
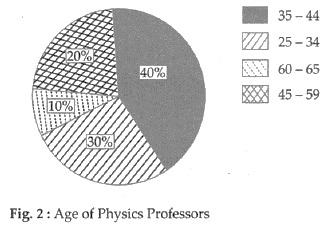
If the number of female Physics professors in the age group 25 — 34 equals 25% of all the Physics professors in that age group, then what is the number of male Physics professors in the age group 25-34?
EXPLANATION
Correct Option (1)
To determine the number of male Physics professors in the age group 25-34, the following steps are undertaken:
- First, ascertain the total number of Physics professors. Based on the provided data, if there are 32 male and 8 female Physics professors, the total number of Physics professors is 32 + 8 = 40.
- Next, calculate the number of Physics professors who fall into the 25-34 age group. If 30% of all Physics professors are in this age group, then the number is \(\frac{30}{100} \times 40 = 12\).
- Subsequently, determine the number of female Physics professors within the 25-34 age group. As stated, this constitutes 25% of all Physics professors in that age group. Therefore, the number of female professors is \(\frac{25}{100} \times 12 = 3\).
- Finally, subtract the number of female Physics professors from the total number of Physics professors in the 25-34 age group to find the number of male Physics professors. This calculation is \(12 - 3 = 9\).
Thus, there are 9 male Physics professors in the age group 25-34.
Incorrect Options:
Options 2 (6), 3 (3), and 4 (2) are incorrect because they do not align with the precise calculations derived from the given data and conditions. The step-by-step computation reveals that 9 is the accurate number of male Physics professors in the specified age group, making these alternatives inconsistent with the problem's parameters.