Q 23 / 46
UPSC CSE Prelims 2015
The proportion of expenditure on various items by two families A and B are represented in the following Bar Charts:
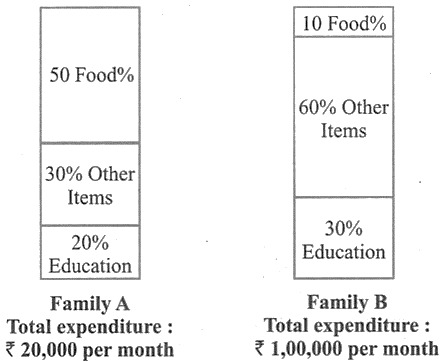
From these charts, we can conclude that
EXPLANATION
Correct Option
To determine the comparative expenditure on food by Family A and Family B, the absolute amounts spent must be calculated based on their total expenditures and the respective proportions allocated to food.
- For Family A:
- Total expenditure = ₹20,000.
- Proportion of expenditure on food = 50%.
- Absolute expenditure on food = = ₹10,000.
- For Family B:
- Total expenditure = ₹1,00,000.
- Proportion of expenditure on food = 10%.
- Absolute expenditure on food = = ₹10,000.
Since both Family A and Family B spent ₹10,000 on food, their expenditures on this item are equal.
Incorrect Options
- Options 1 ("Family A spent more money on food than Family B") and 2 ("Family B spent more money on food than Family A") are incorrect. The calculations demonstrate that both families incurred an identical expenditure of ₹10,000 on food.
- Option 4 ("The expenditure on food by Family A and Family B cannot be compared") is incorrect. The necessary data, including the total expenditure for each family and the proportion allocated to food, is available, allowing for a direct and precise comparison of their absolute expenditures.